Strategies to Address Greenhouse Gas Emissions
Updated Greenhouse Gas Reduction Strategy Now Available
Download the 2017 Greenhouse Gas Reduction Strategy document here.
Introduction
In 2010, the San Francisco Planning Department published the Greenhouse Gas Reduction Strategy in compliance with the California Environmental Quality Act (CEQA) Air Quality Guidelines. This served to evaluate the air quality impacts of the projects and plans proposed in the San Francisco Bay Area according to the Bay Area Air Quality Management District (BAAQMD) thresholds of significance. The report was a compilation of implementation efforts to address the strategies outlined in the 2004 Climate Action Plan. Since the 2010 Greenhouse Gas Reduction Strategy, the Department of the Environment has published the 2013 Climate Action Strategy, the city’s 2012 emissions report has been released, and the Planning Department has introduced new measures to address greenhouse gas emission reduction strategies. This document aims to serve as the 2017 update to the policies, plans, and codes that the city and Planning Department have implemented to assist in achieving the city’s ambitious climate action goals.
Targets
The most recent greenhouse gas emissions reduction targets for the City & County of San Francisco were adopted in 2008. These goals are more aggressive than those outlined for the state of California by Assembly Bill 32 (“Global Warming Solutions Act of 2006”). A brief timeline of city and state greenhouse gas reduction goals is outlined below.
2002 San Francisco’s original GHG reduction targets were passed by the Board of Supervisors in 2002 with Resolution 158-02. This resolution establishes a goal of reducing GHG emissions to 20 percent below 1990 levels by 2012.
2004 In September 2004, the San Francisco Department of the Environment (SF Environment) and the Public Utilities Commission (SFPUC) published the Climate Action Plan for San Francisco: Local Actions to Reduce Greenhouse Emissions (Appendix A). The Climate Action Plan included both an emissions inventory and projections.
2005 Governor Schwarzenegger adopted Executive Order S-3-05 to set a greenhouse gas reduction target of 2000 emission levels by 2010, 1990 emission levels by 2020, and an 80% reduction below 1990 levels by 2050.
2006 Assembly Bill 32, the California Global Warming Solutions Act of 2006 (CA Health and Safety Code Section 38,500 et seq.) was signed into law in 2006. AB32 calls for the following:
Reduce greenhouse gas emissions to 1990 levels by 2020
The California Air Resources Board (CARB) to develop a Scoping Plan that outlines the state’s strategy to achieve compliance with the targets. This Scoping Plan must be updated every five years (the most recent update was approved in 2014).
2008 In May 2008, San Francisco adopted ordinance 81-08 amending the San Francisco Environment Code to establish City GHG emission targets, superseding Resolution 158-02. In addition to reduction goals, ordinance 81-08 mandated City departments to publish annual reports and reduction plans to achieve compliance. The following GHG emission reduction limits and target dates remain the goals for the City and County of San Francisco:
- Determine 1990 City GHG emissions by 2008, the baseline level with reference to which target reductions are set
- Reduce GHG emissions by 25 percent below 1990 levels by 2017
- Reduce GHG emissions by 40 percent below 1990 levels by 2025
- Reduce GHG emissions by 80 percent below 1990 levels by 2050
2015 On April 29, 2015, Governor Brown signed executive order B-30-15, pursuant to Senate Bill 32 (2014) which established a mid-term target of 40% reduction of 1990 greenhouse gas emissions levels by 2030. This goal was implemented to help the state achieve 80% reduction by 2050.
2016 On August 24, 2016, the California legislature passed Senate Bill 32, which amended the California Global Warming Solutions Act of 2006. SB 32 directs the State Air Resources Board to facilitate the reduction of greenhouse gas emissions to 40 percent below 1990 levels by 2030.
2017 On On July 25, 2017, Governor Brown signed Assembly Bill 398, which will extend the California Cap and Trade Program until 2030, instead of allowing it to expire in 2020. The program is five years old and is the only one of its kind in the United States, requiring companies to buy permits to release greenhouse gas emissions.
Progress to Date
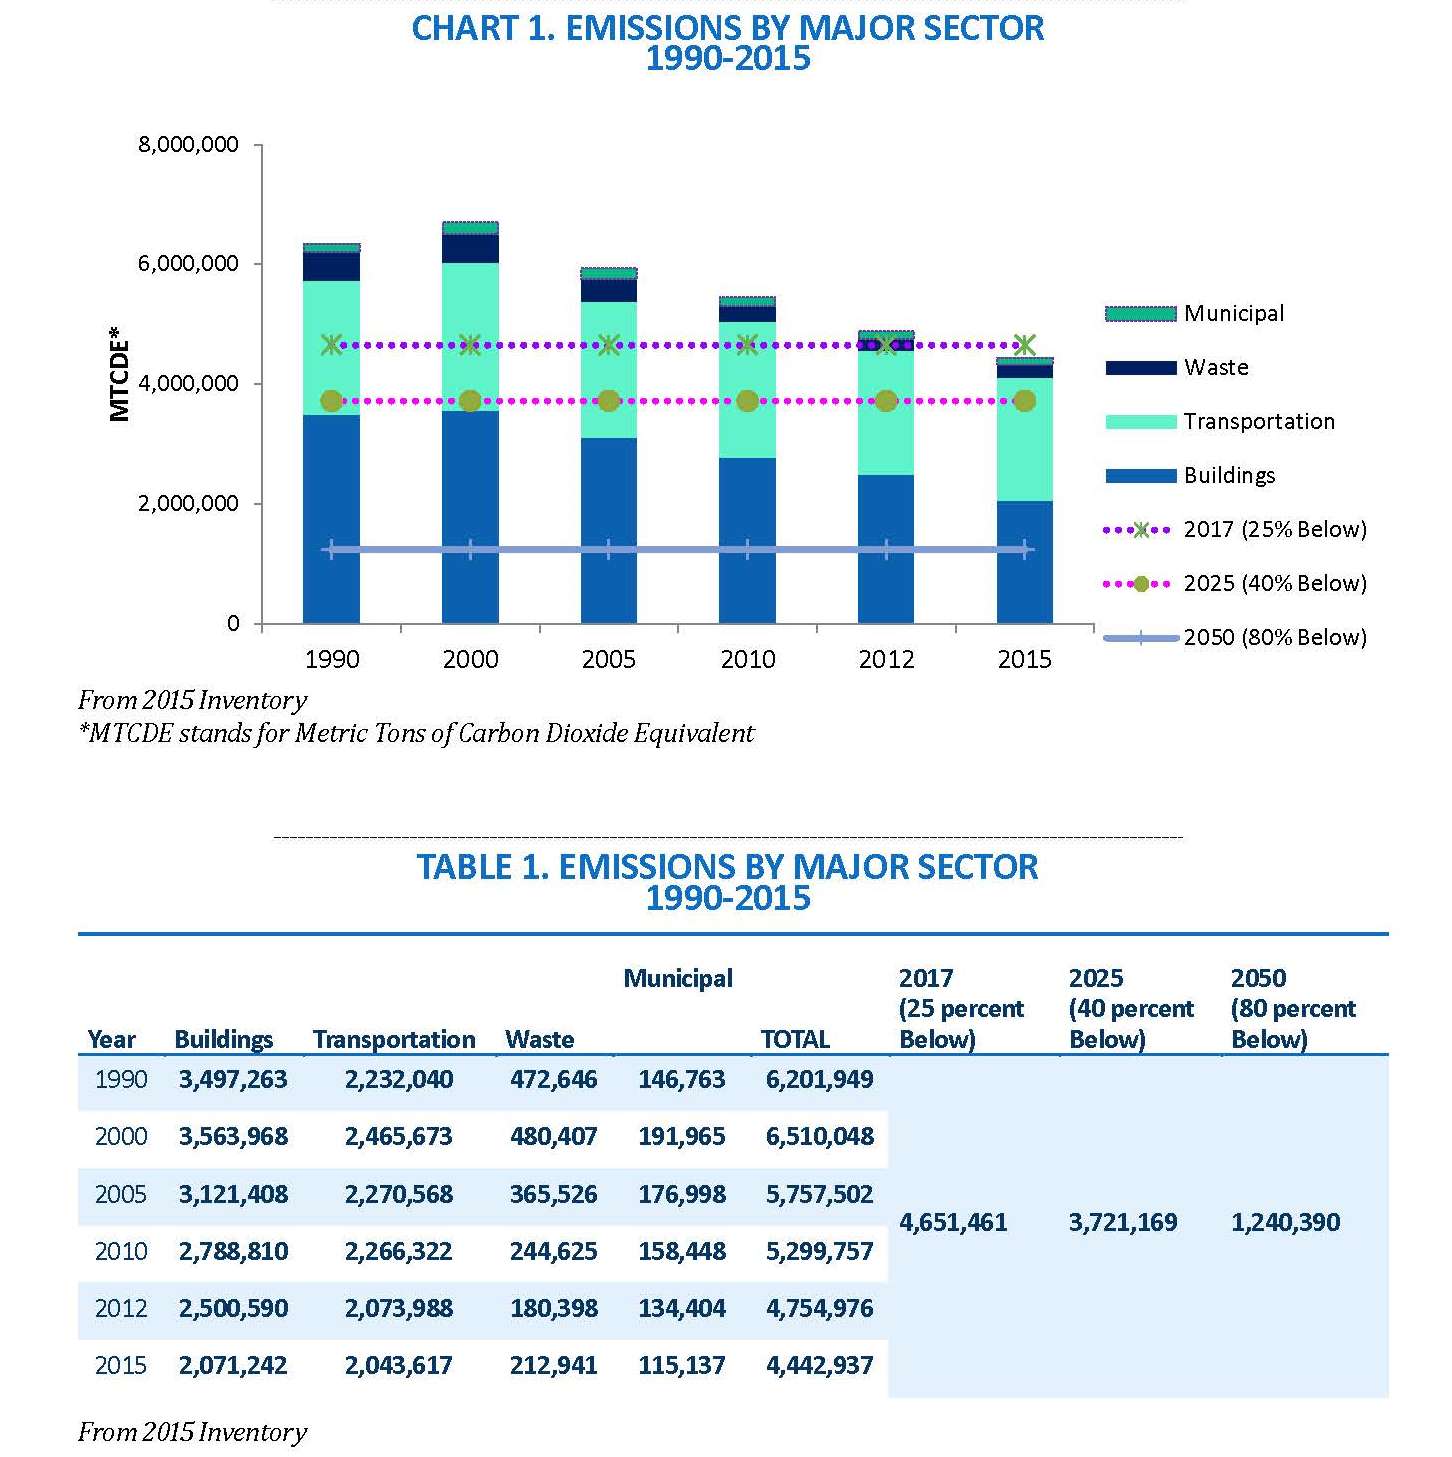
In 2013, the SF Environment published an updated Climate Action Strategy. According to the report, San Francisco’s greenhouse gas emissions in 2010 were 14.5 percent below 1990 levels. Since the report was published, there was an update to the 2012 inventory in 2015.
Despite a 19.5 percent growth in population and a 78 percent growth in GDP, San Francisco’s 2015 emission levels were 28.4 percent below 1990 levels, thus achieving a major reduction milestone of a 25 percent reduction by 2017, per San Francisco Board of Supervisors ordinance 81-08.


Documents & Resource Guides
- 2017 Update: Greenhouse Gas Reduction Strategy Update, July 2017
- Greenhouse Gas Applications
- Letter from the Bay Area Air Quality Management District, October 28, 2010
- Strategies to Address Greenhouse Gas Emissions, City and County of San Francisco, November 2010
- Appendix A: San Francisco Climate Action Plan
- Appendix B: 2008 Greenhouse Gas Reduction Ordinance
- Appendix C: Independent Review of San Francisco's Greenhouse Gas Emissions
- Appendix D: San Francisco's 2005 Municipal Greenhouse Gas Emissions
- Appendix E: SFMTA's Draft Climate Action Plan
- Appendix F: Land Use Index of the San Francisco General Plan
- Appendix G: Environmental Documentation
- Appendix H: Administrative Bulletin 0-93 - Green Building Implementation
Contacts
|
Jenny Delumo |
Christopher Espiritu |
Lana Russell-Hurd |
[1] San Francisco Department of the Environment and San Francisco Public Utilities Commission, Climate Action Plan for San Francisco, Local Actions to Reduce Greenhouse Emissions, September 2004, http://sfenvironment.org/sites/default/files/fliers/files/climateactionplan.pdf. Accessed August 3, 2016.
[2] The U.S. has committed to 42% reductions below 2005 levels by 2030, in accordance with the Copenhagen Accord. This is equivalent to 35% below 1990 levels by 2030. California Air Resources Board, Climate Change Scoping Plan, 2013, http://www.arb.ca.gov/cc/scopingplan/2013_update/first_update_climate_change_scoping_plan.pdf. Accessed August 3, 2016.
[3]ICF International, Memorandum: Technical Review of the 2012 Community-wide GHG Inventory for the City and County of San Francisco, January 2015, http://sfenvironment.org/sites/default/files/fliers/files/icf_verificationmemo_2012sfecommunityinventory_2015-01-21.pdf. Accessed August 3, 2016.
[4] The ICF reports that “It should be noted that the 1990 inventory includes some differences in methodology when compared to the 2012 inventory, resulting in minor limitations in comparability between the two inventories.”
